Measuring glucose concentration A Level Biology
During this required practical, students are going to prepare a serial dilution of glucose solution which they will then analyse using colorimetry to produce a calibration curve in order to identify the concentration of glucose in a mystery ‘urine’ sample.
Three samples of Urine labelled ‘A’ ‘B’ and ‘C’
Subject: Biology | Level: A Level |
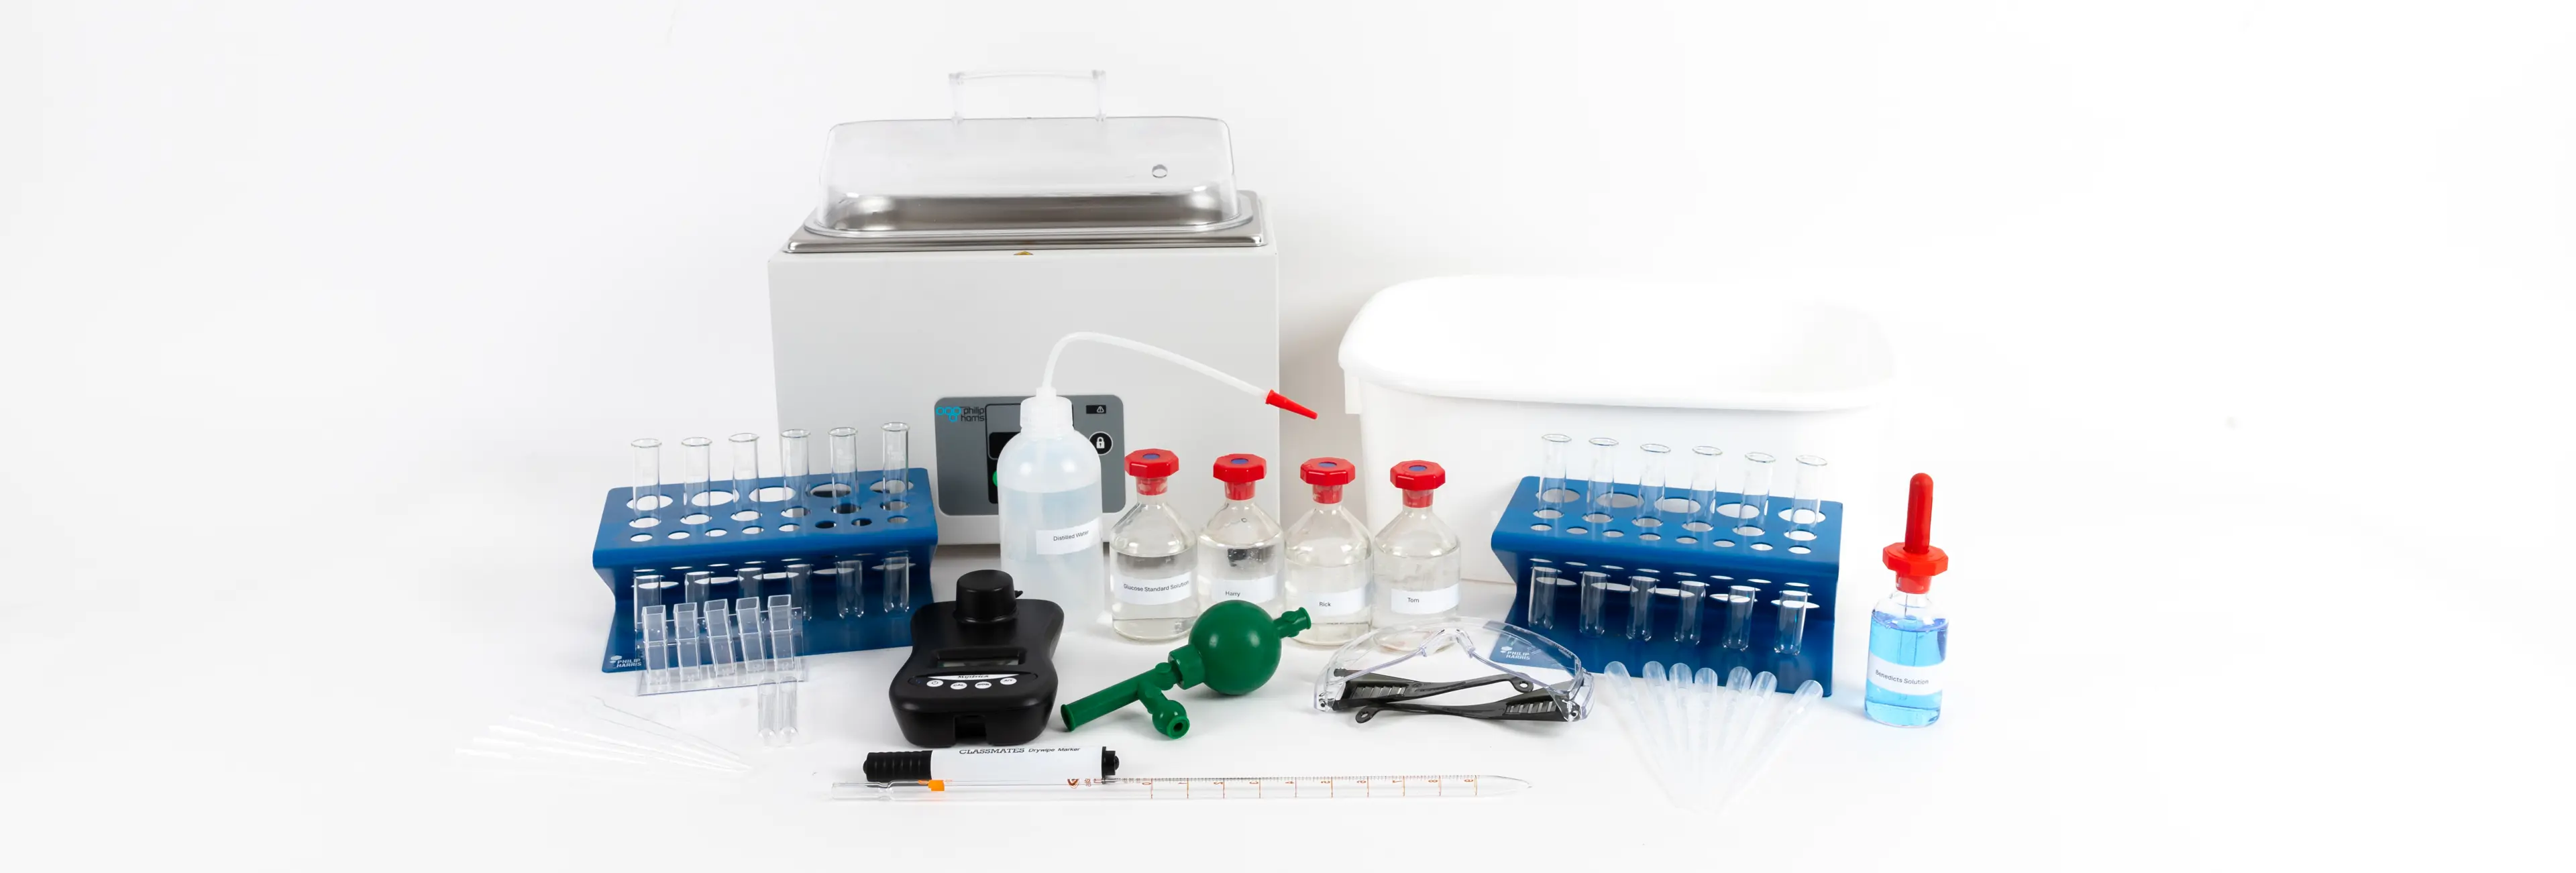
You will need:
• Safety Glasses
• 2ml Graduated Glass Pipette
• 10ml Pipette Filler
• 16 x 125mm test tubes
• Test Tube Rack
• Marker Pen
• CLEAPSS HAZCARDS 27C, 36C, 40C, 95A
Method
Preparation of the Urine samples for testing:
· Label three test tubes with the name of the patient ‘A’ ‘B’ and ‘C’ and add 2cm³ of each sample to the corresponding test tube.
· To each test tube add 2cm³ of Benedict’s solution, and mix the contents of all three test tubes
Preparation of the glucose calibration curve:
· Label six more test tubes as 0 to 10 mmol dm¯³ using the concentrations shown in the table below.
· Dilute the glucose standard provided (10 mmol dm¯³) with deionised water in the labelled test tubes. You are provided with a table to complete to show the volume of water and glucose standard required to make the dilution to achieve the concentration shown in the table.
Students are usually given a blank table to complete the figures highlighted in yellow.
Glucose Solution
(mmol dm-3)0.0
2.0
4.0
6.0
8.0
10.0
Volume of Water
(cm3)2.0
1.6
1.2
0.8
0.4
0.0
Volume of standard
Glucose Solution0.0
0.4
0.8
1.2
1.6
2.0
2 cm³ of Benedict’s Solution is added into each test tubes and the solutions are mixed by gently shaking the test tube.
All nine of the test tubes are now placed in a water bath which is set to 90°C and are left to develop for approximately 4-5 minutes. The tubes are then removed from the water bath and are left to one side to cool.
Students need to zero the colorimeter first. They should use the 0.0 mmol dm³ tube to do this. They are going to measure the absorbance of each of the diluted glucose samples first.
Students plot their values for absorbance of the standard samples onto a graph of absorbance against the known concentrations of glucose.
The colorimetry procedure is repeated for the three patient samples.
The absorbance values can be read off the graph to discover the glucose concentration of each of the patient samples.
Technician tips
10 molar glucose solution is made by dissolving 1.8g glucose in 1 litre of water.
The concentrations of the patient samples do not matter as long as they differ from each other and the standard solution.
A tea bag can be used to make the colour of the patient samples closer to the colour of urine.


