Investigating pH change A Level Chemistry
Investigating pH change at the A-level involves titrating acids and bases to create pH curves, which show how the pH of a solution changes as a substance is added. This practical helps students understand the concepts of neutralisation, equivalence points, and the strength of acids and bases.
Subject: Chemistry | Level: A Level |
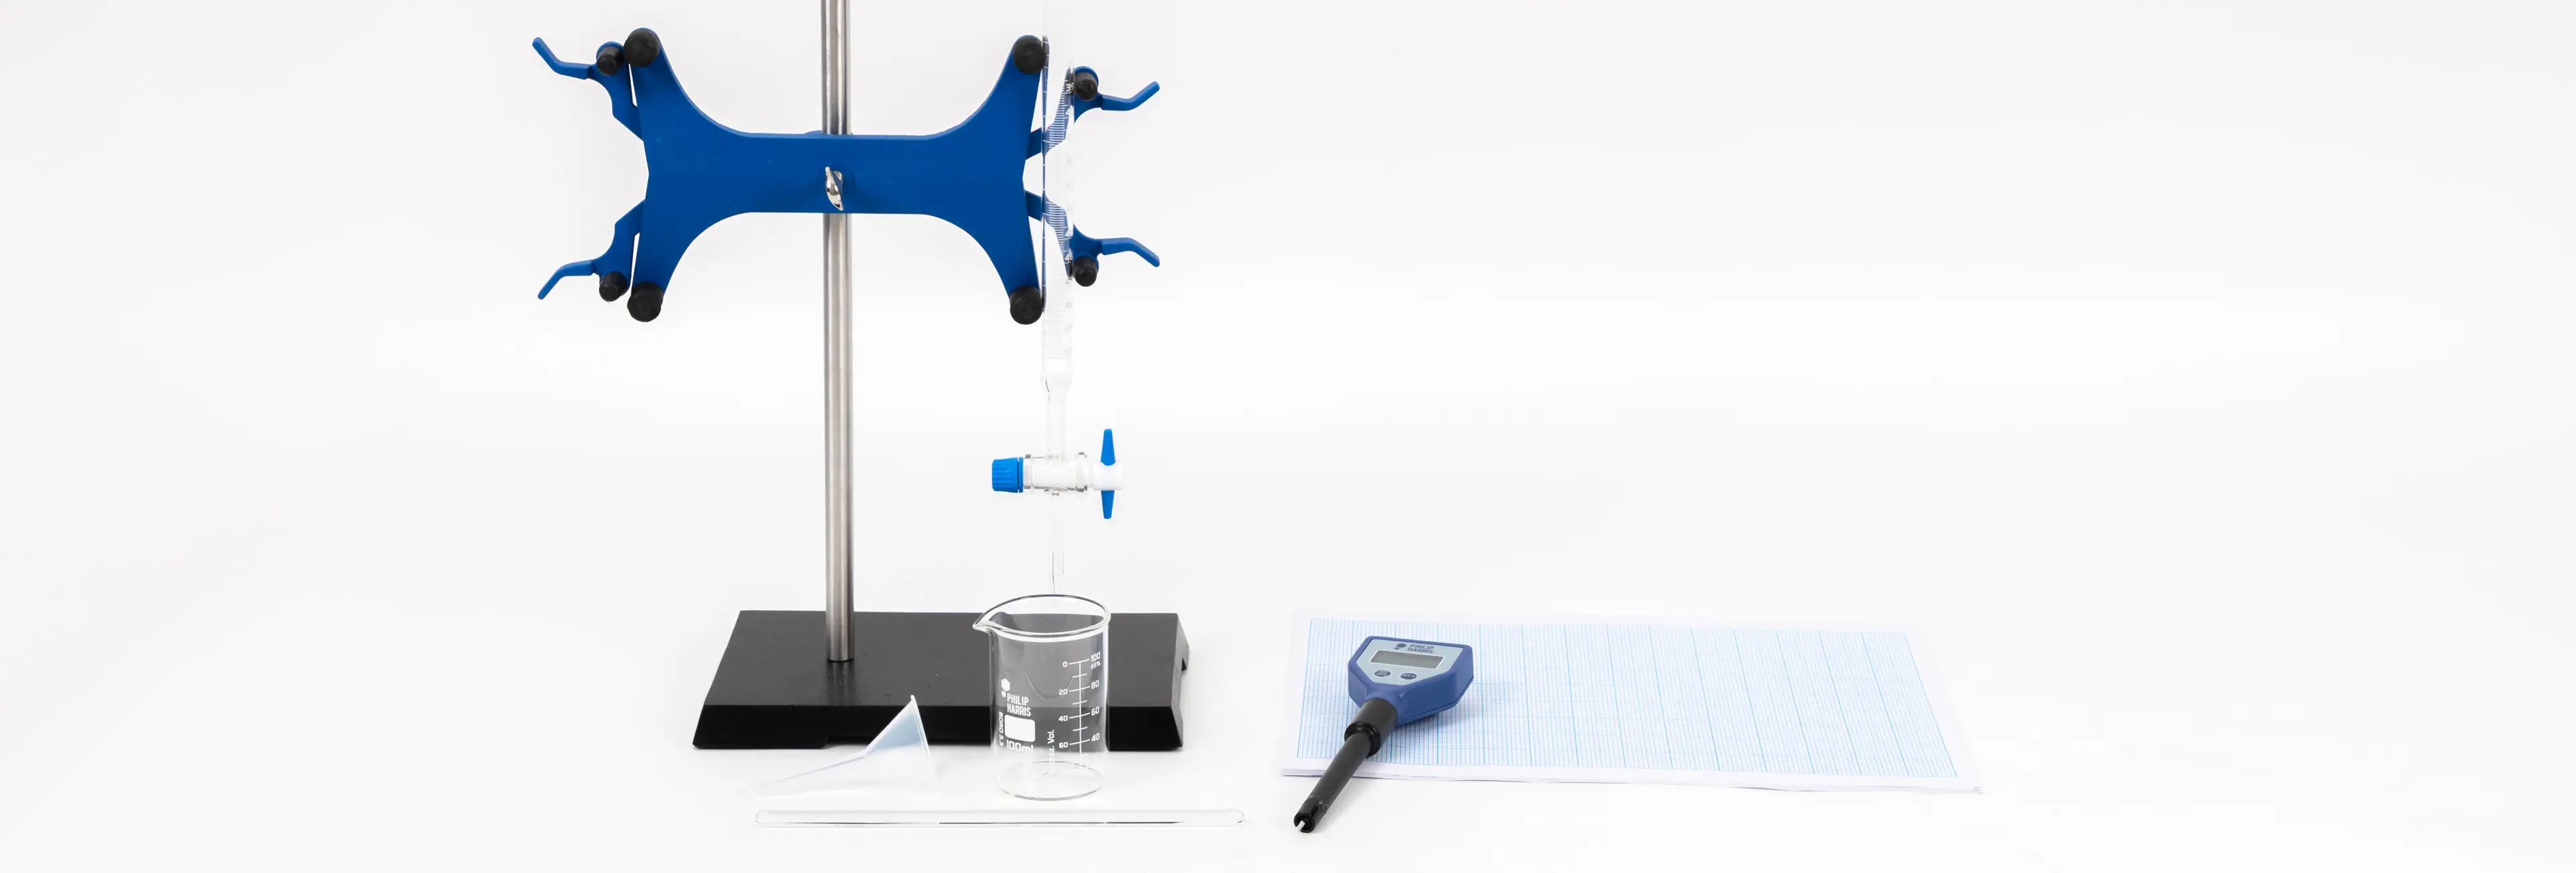
You will need:
Method
Part 1 Calibrate the pH meter:
Rinse the pH probe with deionised water and shake gently to remove excess. Place the probe in the standard pH 7.0 buffer solution, ensuring the bulb is fully immersed. Record the pH reading in a suitable table.
Repeat this process using the standard pH 4.0 and 9.0 buffer solutions. Rinse the pH probe with deionised water before taking each reading. Record the pH readings in your table
Plot a graph of the readings on the x-axis against the pH of the buffer solution. Your graph may be a straight line or a curve. This graph will be used in the next part of the experiment to convert pH readings into accurate pH values
Part 2 The measurement of the pH of the mixture of acid and alkali
Method:
Rinse a burette with a 0.1M solution of Ethanoic acid provided and then fill the burette with this solution, run the solution through the burette to remove any air bubbles from the tap and the tip of the burette. Refill the burette up to the zero mark.
Use the burette to transfer exactly 20ml of Ethanoic acid to a clean 100ml beaker
Rinse a second burette with the 0.1M Sodium Hydroxide solution provided and then fill this second burette with this solution, ensuring you remove any air bubbles, as before, then refill up to the zero mark
Rinse the [H probe with deionised water and clamp it so the bulb is fully immersed in the Ethanoic acid solution in the beaker. Use a rod to stir the solution gently and record the pH reading in a suitable table
Using the second burette, add exactly 2ml of the Sodium Hydroxide solution to the beaker containing the Ethanoic acid. Stir the mixture gently with the rod and measure the pH of the mixture. Record the pH reading
Add the Sodium Hydroxide solution in 2.0ml portions from the second burette to the Ethanoic acid in the beaker until 18ml of the Sodium Hydroxide has been added. Take a pH reading after each addition of Sodium Hydroxide solution, and record the pH reading in your table
Add the Sodium Hydroxide solution in 0.20ml portions until 22ml is reached
Add the Sodium Hydroxide solution in 2ml portions again until 40mls have been added
Rinse the pH probe with deionised water when you have taken all of your readings
Analysing the data:
Use your calibration graph from part 1 to adjust the pH readings obtained in your experiment in part 2. These corrected pH values should be entered into a new column in the results table
Plot a graph of the corrected pH values from part 2 along the y-axis against the volume of Sodium Hydroxide solution added
Join the points in the most appropriate way
Comment on the shape of the curve
Technician tips
Teachers may choose to use other weak acid/strong base combinations or strong acid/weak base combinations
The pH buffer solutions can be bought in ready made or as tablets which can then be made up


