
Simple harmonic systems: pendulum - A Level Physics
An investigation into simple harmonic motion using a simple pendulum.
Students must investigate simple harmonic motion. The practical links period and oscillation to mass, length, or spring constant. Students are assessed on timing methods and controlling amplitude. The investigation involves recording periods in a table for different masses or lengths and plotting graphs to compare results with theory.
Subject: Physics | Level: A Level |
You will need:
• Retort stand
• Clamp
• Drawing pin
• Blu Tac
• Metre ruler
• Stop clock
Method
Preparation and setup
Attach the pendulum bob to the string and clamp it between two wooden blocks.
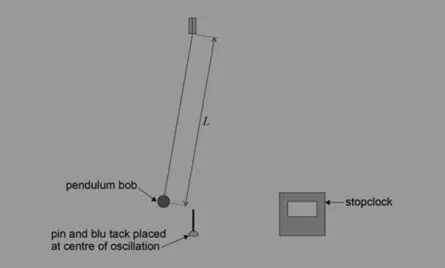
Position the pin with Blu-Tack immediately below the pendulum bob. This will be at the centre of the oscillation when the pendulum oscillates.
Conducting the experiment
Measure the length, L, of the pendulum from the point of suspension to the centre of mass of the pendulum bob. (It might be easier to measure to the top of the pendulum bob and then add on the radius of the bob to give L.)
Carefully pull the pendulum bob to the side and release it. The pendulum should oscillate with small amplitude and in a straight line. Check that it continues in a straight line by viewing the oscillation from the side – if not stop it and start the oscillation again.
Determine the time of the simple pendulum by timing 10 complete oscillations.
Repeat the experiment
Take repeat readings of the time for 10 oscillations, T10.
Change the length of the pendulum and repeat the process to determine the time period.
Determine the time period of the pendulum for at least seven different lengths, L.
Calculations and Analysis
Simple pendulum
Tabulate your data, including columns for L, T10, repeat values of T10, mean value of T10, time period for one oscillation T, and an additional column for T2.
Plot a graph of T2 on the y-axis against L. A straight line through the origin verifies that T2 is proportional to L.
Measure the gradient of the graph and use it to determine a value for the acceleration due to gravity, g.
Estimate the uncertainty in your values of L and T. Hence estimate the uncertainty in the value of g.
T = 2π √ l / g
Gives T2 = 4π2 L / g
hence g = 4π2/ gradient
Technician tips
For accurate results it is important the pendulum oscillates with small amplitude and in a straight line.
The pendulum should be suspended with a pin and Blu-Tack acting as a fiducial marker, placed immediately below the pendulum bob. This will be at the centre of the oscillation when the pendulum oscillates.


